
Since the early 90’s and accelerating after the 2008 Financial Crisis, Canada’s capital markets have evolved in how capital is raised and allocated, including the growth of exchange‑traded funds (ETFs) and a reduction in the number of companies listed on the Toronto Stock Exchange (TSX).
Public companies vs. ETFs listed on the TSX
ETFs listed on the TSX have grown approximately 1,400% from 2008 to October 2025. There are now 1,280 funds listed on the TSX, up from 84 in 2008.
In contrast, publicly listed companies on the TSX have fallen by approximately 45%, from 1,236 to 675 over the same time period.
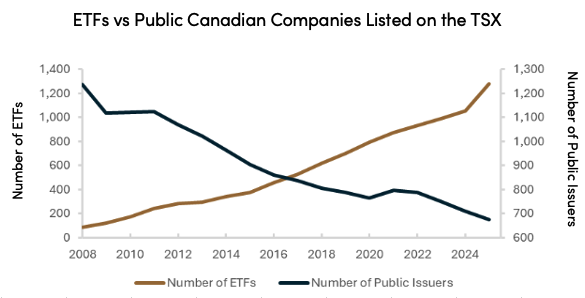
Source and additional notes: As of October 2025, all data shown on this chart are from the TSX website, including archived data. TMX TSX | TSXV | Market Statistics & Reports.¹
The rise in the number of ETF products, particularly for retail investors, may influence how investment capital is distributed across public markets, with a greater share of new investment flowing toward larger companies. This shift may result in relatively lower allocations to small‑ and mid‑ capitalization companies. In 2025, the average market capitalization of companies listed on the TSX was $6 billion, up from $1 billion in 2008. ²
Taken together, these trends suggest that the expansion of ETFs may be associated with increased concentration of investment in larger companies, with potential implications for capital availability for small- and mid-capitalization issuers.
This shift is further reflected in the decline in Initial Public Offerings (“IPOs”) on the TSX. The number of IPOs on the TSX has fell by approximately 71% to two new listings from 2023 to 2025, down from the 10-year average of eight new listings, underscoring broader changes in capital formation within Canada’s public markets.²
Capital Shifts
The growth of ETFs has made global investing more accessible, which may be affecting how much Canadian equity exposure some investors hold.
According to information published by Bloomberg, among all the ETFs listed on the TSX, approximately 57% of capital invested in ETFs is invested into U.S. and Global companies compared to 43% to Canadian-listed companies.⁴
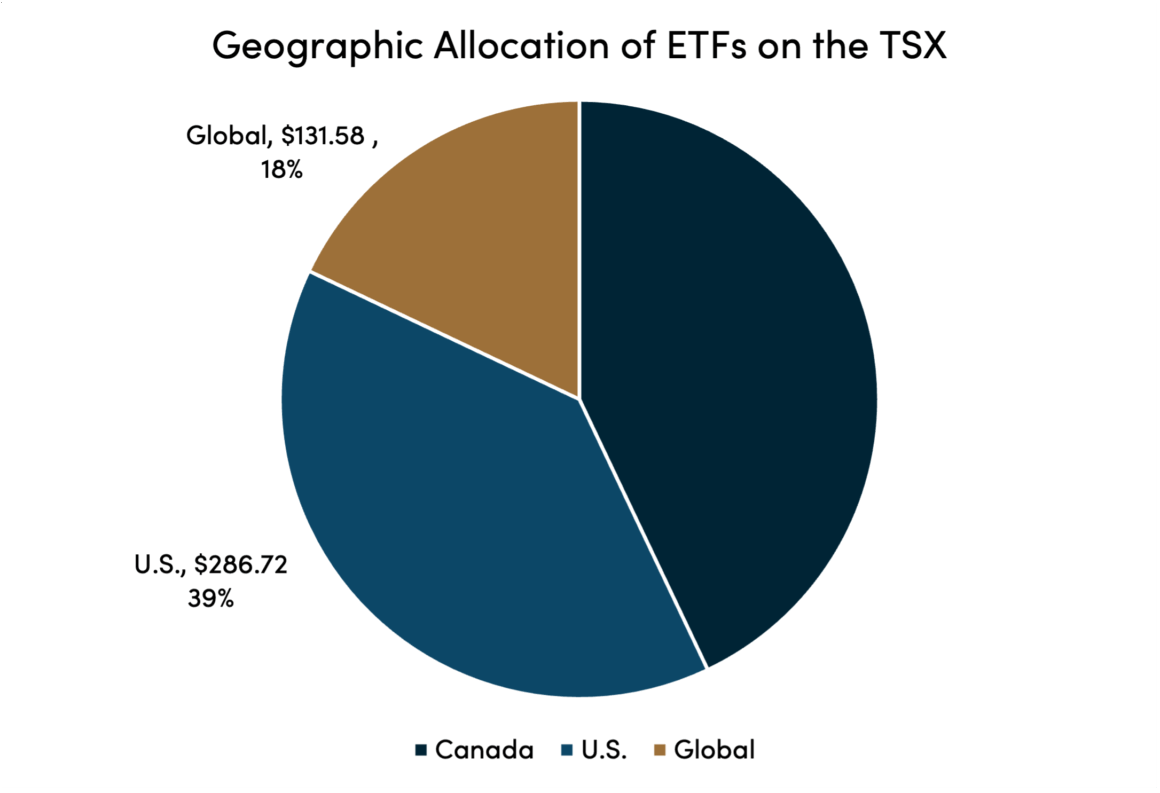
Source and additional notes: As of December 8th, 2025, all data shown on this chart is taken from Bloomberg.⁴
Meanwhile, U.S. listed ETFs invest domestically, with approximately 80% of assets invested in ETF products domiciled in the U.S., with just under 2% allocated to Canadian securities, as illustrated below.⁴
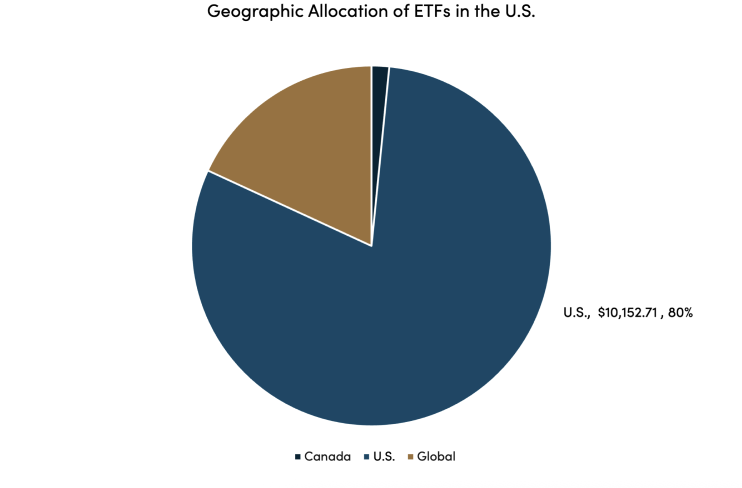
Source and additional notes: As of December 15th, 2025, all data shown on this chart is taken from Bloomberg.⁴
For any investors looking at passive investment vehicles who wish to maintain exposure to Canadian markets, it becomes increasingly important to strengthen due diligence practices – including reviewing geographic allocation, top 10 holdings, and the asset mix of each investment vehicle. As investors gain a clearer understanding of how assets are allocated within these products, they can make more intentional decisions about their exposure to domestic markets and their support of Canadian investment.
Unlocking potential with small/mid-cap funds
Historically, Canadian small and mid-cap mutual funds have accounted for the majority of assets in this class, as ETFs have been predominantly concentrated in large-cap securities. More recently, however, data from Morningstar indicates that small-cap ETFs have started to show steady inflows, with a notable uptick of around $500 million inflow in 2025.⁵
Total Net Assets in Canadian Small/Mid Cap Funds ($M)
| Year | ETF Net Assets ($M) | Mutual Fund Net Assets ($M) | Total Net Assets ($M) |
| 2020 | $466 | $11,178 | $11,644 |
| 2021 | $530 | $13,367 | $13,897 |
| 2022 | $449 | $10,762 | $11,212 |
| 2023 | $488 | $10,705 | $11,192 |
| 2024 | $676 | $12,434 | $13,111 |
| 2025 | $1,178 | $14,285 | $15,464 |
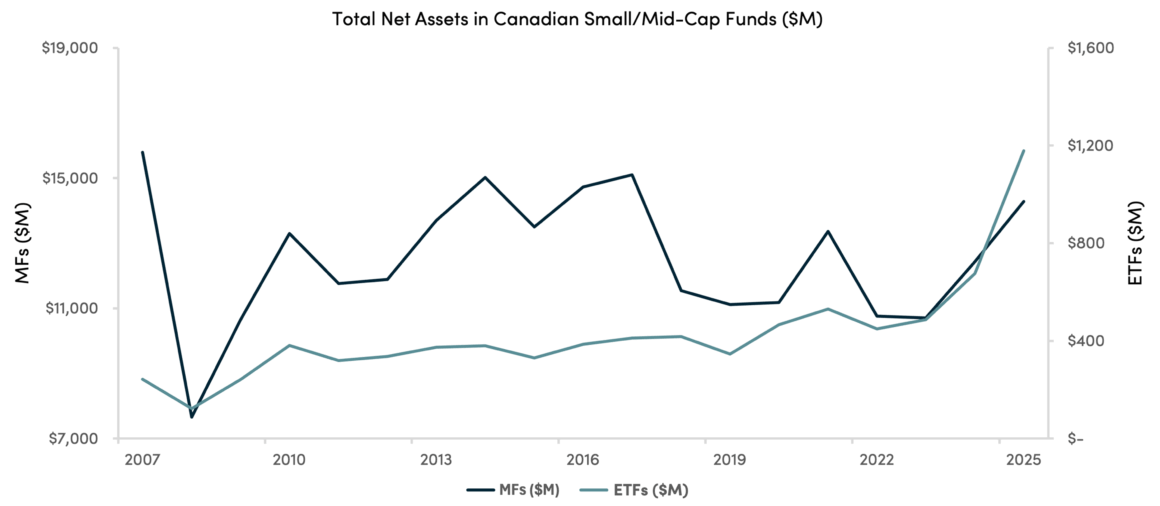
Source and additional notes: As of December 17th, 2025, all data shown in the table and chart is taken from Morningstar.⁵
It’s a shift that may indicate that some investors are broadening their exposure beyond large capitalization companies and are seeking better risk-adjusted returns and diversification through small capitalization companies.
Because small-cap companies can have higher growth potential, they may offer investors the opportunity to capture outsized returns compared to larger companies.
Given the relatively cyclical nature of this asset category, active portfolio management may fare better than a passive approach – as would a focus on concentrated yet diversified portfolios to deliver attractive risk-adjusted returns.
Lower interest rates may further support small-cap performance, as smaller companies typically benefit from reduced cost of financing and improved valuation.
What investors can do
Overall, the expansion of ETF offerings, particularly those providing broad U.S. and global exposure, has coincided with increased investor allocations to overseas markets, which may reduce the relative share of capital directed toward Canadian equities, including IPOs on the TSX.
For investors, paying attention to these trends means they can be aware of where market dynamics are at, and could be an invitation to exercise due diligence when selecting ETFs. They may choose to consider allocating directly to Canadian small- and mid-cap funds, which present compelling growth opportunities and diversification benefits.
By prioritizing active management and allocating capital to small-medium sized public companies, Canada can take one step forward in strengthening its capital markets and fostering innovation.
References
1. “TMX Group.” TMX.Com, www.tmx.com/en. Accessed 28 Nov. 2025.
2. Cherniavsky, Ben, and Jock Finlayson. “Canada’s Shrinking Stock Market.” Fraser Institute, Fraser Institute, 18 Dec. 2025, www.fraserinstitute.org/studies/canadas-shrinking-stock-market-causes-and-implications-future-economic-growth.
3. Kalafatis, Thomas. “Re-Energizing Canada’s Public Equity Markets.” IIAC ACCVM, IIAC ACCVM, 5 Nov. 2024, iiac-accvm.ca/podcast/re-energizing-canadas-public-equity-markets/.
4. Bloomberg L.P. (2026). [ETF & Public Issuer Data from Canadian & US Capital Markets]. Bloomberg Terminal. Accessed December 8, 2025.
5. Morningstar Inc. (2026). [Small/Mid-Cap Equity ETFs Total Net Assets]. Bloomberg Terminal. Accessed December 8, 2025.
Disclaimer
Lysander Funds Limited pays a fee to Financial Pipeline to post content on their website, which may be construed as promotion of Lysander Funds Limited, its affiliates or the Lysander Funds. Lysander Funds Limited and Financial Pipeline are affiliates
The views and information expressed in this article are for informational purposes only. They are not intended as investment, financial, legal, accounting, tax or other advice and should not be relied upon in that regard. Commissions, trailing commissions, management fees and expenses all may be associated with mutual fund investments. Please read the prospectus before investing. Investment funds are not guaranteed, their values change frequently and past performance may not be repeated.
®Lysander Funds is a registered trademark of Lysander Funds Limited.