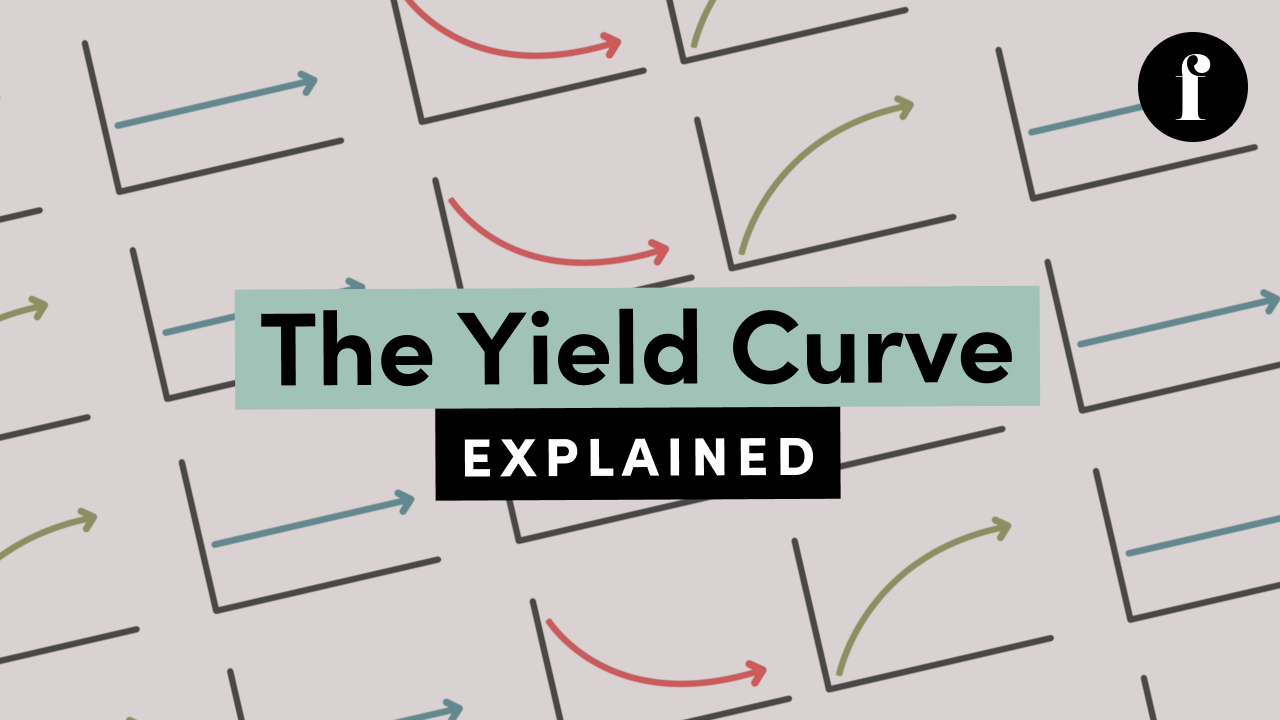
The yield curve is a popular financial indicator because it can provide some guidance about the health of the economy and give hints as to which way interest rates and inflation may go. It plots multiple yields for bonds of different maturities on a line, which serves as a graphical representation of the yields investors expect to earn if they lent money for different periods of time.
The bond yield is plotted on the vertical axis and time to maturity is on the horizontal axis. The yield curve comes in three shapes.
A normal yield curve – where short-term yields are lower than long-term yields – has an upward-sloping line. A steepening yield curve typically suggests that short-term interest rates are poised to move higher, and usually means the economy is in good shape. If the yield curve is flat, that means there is little or no difference in short and long-term yields. This usually occurs when there is a transition from a normal yield curve to an inverted yield curve. And the inverted yield curve tells you that short-term yields are higher than long-term yields. The yield curve usually inverts when long-term investors believe that interest rates are poised to go down. Both the flat and inverted curve can signal trouble ahead, but it’s not a guarantee things will unfold that way.
To learn more about the yield curve and what it says about the economy, check out financialpipeline.com


