The yield curve is one of the most closely watched bits of financial data. This is because the curve can give investors an indication about the direction of interest rates and inflation pressures. It can also supply an indication of whether the economy is about to head into recession.
The yield curve is also known as the term structure of interest rates. Essentially, it plots the yield spread between various maturities of bonds of similar risk. U.S. Treasurys or government bonds are the most commonly used because they are essentially risk-free. They are also used as a benchmark in assessing corporate debt.
The curve covers a number of maturities, everything from U.S. Treasury Bills, which are very short-dated at three months, to 30-year U.S. government bonds.
“You can plot as many points along that as you want but typically people look at two-years, five years, 10 years and 30 years,” said Brian Carney, a vice-president at Canso Investment Counsel in Richmond Hill, Ont.
“It gives you a sense of where the U.S. government borrows for various maturities, and the U.S 10-year Treasury bond is the benchmark.”
The yield curve comes in three shapes. First, a normal yield curve reflects circumstances where short-term yields are lower than long-term yields. We say “normal” because one would think that an investor should be able to demand a greater return for loaning money for 10 years as opposed to two years, in large part because of the risk of higher inflation, which can erode the value of a bond.
A flat yield curve reflects little or no difference in short and long-term yields.
And the inverted yield curve tells you that short-term yields are higher than long-term yields.
Both the flat and inverted curve can signal that the market sees trouble ahead.

A flattening yield curve can be predictive, but it’s not always.
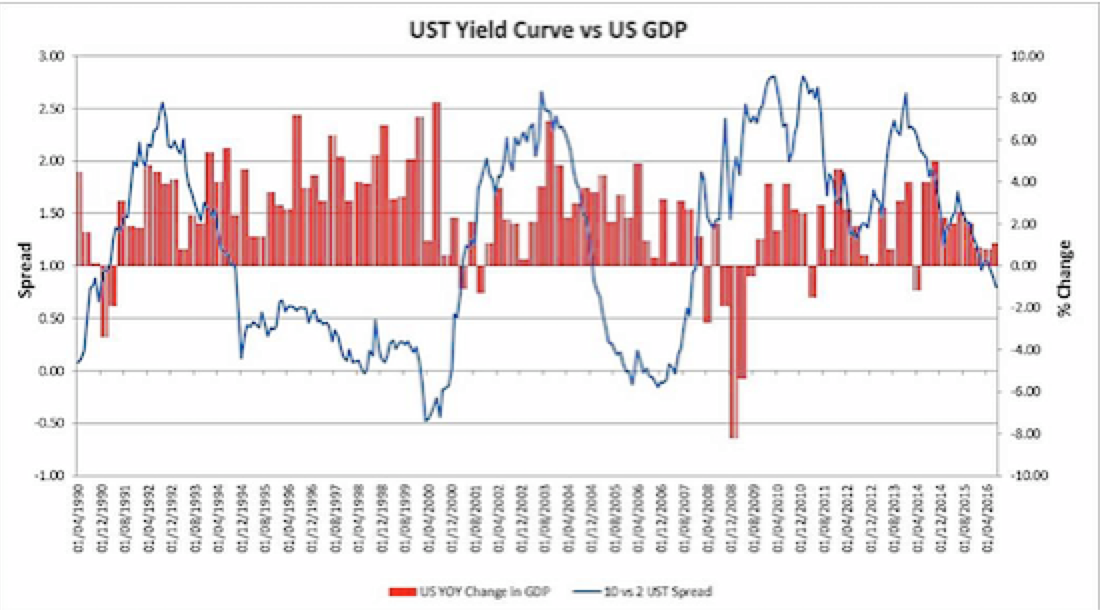
In the case of an inverted yield curve, however, “the predictive power is almost perfect,” said Carney.
“An inverted yield curve and longer-dated securities yielding less than shorter-dated securities almost always tells you that four to six quarters out, the economy is going into recession.”
But, he added, these are not ironclad indicators in the post-2008 financial crisis world.
In the past, negative signals from the yield curve were accompanied by declines in U.S. employment gains, as well as a sharp drop in manufacturing data.
In 2016, the yield curve was at its flattest point since the financial crisis of 2007/2008, and the spread between U.S. Treasurys was at its narrowest since that time – about 0.75 of a percentage point. That was down sharply from a spread of about 2.5 per cent at the beginning of 2015.
It’s not quite so easy to say this narrowing of spreads between 10-year and two-year debt portends a recession.
For one thing, in the 2016 scenario, U.S. economic figures were strong amid strong employment gains.
At the same time, U.S. government bond yields have been plumbing to record lows. But Carney said there are likely good reasons for that.
“One of the reasons why we have seen a downdraft in yields, particularly in the U.S., is there are negative yields in a number of sovereign bond markets around the world,” he said.
“And so if I buy sovereign bonds and I look at U.S. Treasuries, even at the end of 2015, they were still at 2.25 per cent. That’s pretty good. It’s not good historically, but in a world where a lot of sovereign debt is trading at a negative yield, 2.25 looks attractive. So, some of that flattening (of the yield curve) is merely the fact that in a low yield world, 2.25 on a U.S. 10-year looks compelling.”
Uncertainty over what the U.S. Federal Reserve will do about future rate hikes also muddied that picture.
“Economic growth has been positive so does (the Federal Reserve) want to raise? Absolutely they want to raise,” said Carney.
That’s because all central banks need the latitude to use interest rates as a stimulant when another downturn does come along, and it’s pretty hard to cut rates when they’re already around or below zero in much of the world.


