The term “bond spreads” or “spreads” refers to the interest rate differential between two bonds. Mathematically, a bond spread is the simple subtraction of one bond yield from another. Bond spreads are the common way that market participants compare the value of one bond to another, much like “price-earnings ratios” are used for equities.
Bond spreads reflect the relative risks of the bonds being compared. The higher the spread, the higher the risk usually is. People referring to bond spreads are generally talking about comparing the yields on federal government bonds, generally considered a country’s most creditworthy bonds, to the bonds of other issuers such as provinces, municipalities or corporations. Bond spreads can also be calculated between bonds of different maturity, interest rate coupon or even different countries and currencies.
Calculating Yield Spreads
Let’s compare a Sears Canada 11% bond due in 1999 (Sears 11/99) with a Government of Canada 9.25% bond due in 1999 (Canada 11/99). To properly understand the concepts of bond spreads, we must first examine the mechanics of how spreads are calculated. The current yield on the Sears 11/99 is 5.3% compared to the Canada 9.25/99 yield of 4.5%.
Below we subtract the Canada yield from the Sears yield to obtain the spread :
5.3% (Sears yield) – 4.5% (Canada yield) = .8% “Spread”
A bond trader would formally refer to this spread in terms of one hundreds of a percent or “80 basis points” (bps) or “beeps” in the jargon of the bond market.
Historical Yield Spreads
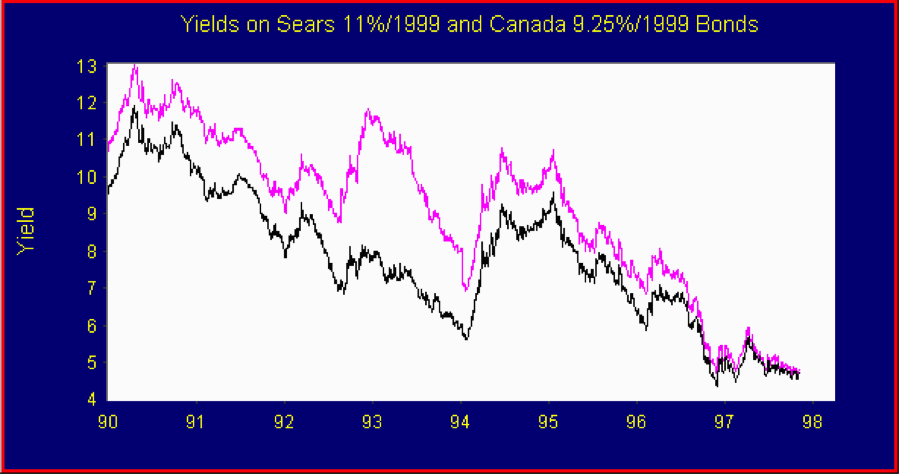
Obviously, the interest rates on both the Sears and the Canada bond will change over time. The chart below shows the yield of the Sears bond since its issue in 1989 and the Canada bond yield for the same time period. Note that the Sears bond has a higher yield throughout the period, reflecting the fact a corporate bond trades at higher yields than a government bond. Inspecting the chart, we also see that the yields move in a very similar pattern, since both bonds have the same term and both are affected by the general changes in interest rates.

Spreads Change over Time
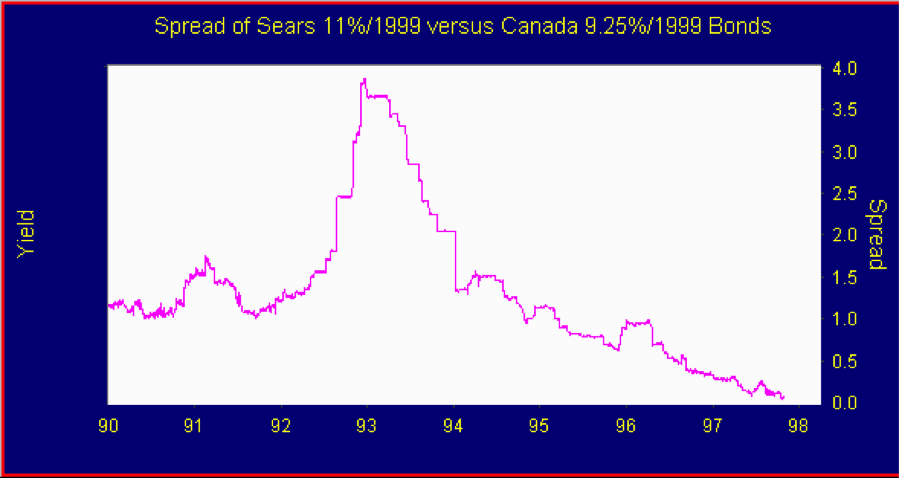
Using computers, we can calculate the yield spread between two bonds over a time period. Below, we take the Sears yield and subtract the Canada yield for each day since June of 1989. Spreads can change considerably as they are based on many factors, as we discuss below. The spread of the Sears Canada 11/99 has moved rather violently in the eight years since it was originally issued in June 1989.

As the spread graph above shows, the Sears 11/99 was originally issued at a spread of 125 bps in 1989 and almost immediately narrowed in to the 80s since the economic cycle was at its peak and things looked good for a retailer. It then widened as the economy weakened into 1990 and gapped to a wide point of 425 bps in the corporate bond debacle of 1992 when the collapse of real estate and Confederation Life led to widespread liquidation of corporate bonds. In 1993, however, when it was apparent that Sears was still solvent and the recession was ending, the bonds tightened back in to their original issue 125 bps spread and have now continued to narrow in to 80 bps.
Types of Spreads
Spreads seem simple but reflect a lot of underlying valuation factors. Here are some of the spreads that can be calculated, as well as their commonly understood meaning:
Credit Spreads are the differences in interest rates that reflect the credit risk between two bonds. The larger or “wider” the spread, the higher the credit risk of the high interest rate bond compared to the low interest rate bond. Corporate bonds generally have higher yields than similar maturity federal government bonds, as in our Sears Canada example above, reflecting their higher default or credit risk. The lower the credit quality and rating, the higher the yield spread compared to governments. That is why “less than investment grade” or “junk bonds” are commonly called the “high yield” sector of the bond market.
Term or Duration Spreads are the spreads that reflect the different interest rates between bonds of different maturity. For example, the current interest rate on the very short-term, two year Canada bond in our example is 4.5% reflecting its minimal capital risk because of interest rate movements. The current interest rate on a thirty-year Canada 8% of 2023 is 6.1%, reflecting its greater “interest rate risk”. The yield spread or “curve spread ” between these two bonds is 1.6%, which reflects the interest rate between the two bonds and the conditions of monetary policy.
Coupon Spreads are spreads that reflect the differences between bonds with different interest rate coupons. For example, the Government of Canada has issued two bonds that are due in 2008, one with a 10% coupon (Canada 10/08) and one with a 7% coupon (Canada 7/08). These two bonds have very similar maturities but very different coupons with a 3% difference in payment each year until the final repayment of the principal of $100 at maturity. Right now, these bonds trade 10 bps apart in yield, reflecting the difference in coupon and liquidity. At one time, there was a very large difference in coupons of over .5% between Canada issues, reflecting the illiquidity of the Canadian bond market and tax preferences of investors. Clearly, a taxable investor would prefer to have less up front taxable income and would prefer to own a “lower coupon” bond. In recent years, the “stripping” activity of investment dealers, which produces “zero coupon” bonds, has caused coupon spreads to narrow considerably as high coupon bonds were sought because of their profitable “stripping” characteristics (higher profits for dealers).
Liquidity Spreads reflect the difference in “liquidity” or ease of trading between bonds. For example, an investor can buy Province of Ontario “zero coupon” bonds for the same maturity date in three different forms: 1) a “coupon” which is a stripped coupon payment from an Ontario bond; 2) a “residual” which is the stripped principal payment from an Ontario bond; and 3) an actual zero-coupon Ontario Global bond issue which was originally issued as a zero coupon “global” bond issue. In terms of liquidity, the “global zero” trades at the lowest spread to Canada bonds, given its high liquidity. The residual trades at a wider spread , reflecting its lower liquidity. The coupon trades at the highest yield and spread , reflecting its smaller size (each “coupon” is ½ of a bond’s stated interest rate, for example, $4 on an 8% interest rate) where the residual is $100.
There are many other types of spreads , such as “swap spreads” which reflect the demand for fixed to floating interest rate swaps or “Yankee spreads” which are spreads between U.S. dollar bonds of domestic and foreign issuers. Investment strategists use the spreads between the dividend yield and earnings yields on stocks and bond yields in their judgments on the relative attractiveness of these markets.
Trading Yield Spreads
Traders use yield spreads as their benchmark for valuing bonds. Most traders have computer trading systems, such as Bloomberg and PC Bond which allow them to quickly calculate historical and actual spreads between many different bonds. To discuss the fundamentals of “spread trading”, one must recall the inverse relationship of bond prices to interest rate movements. Remember that an increase in interest rates for an existing bond leads to a decline in price and that a decrease in interest rates leads to an increase in a bond’s price.
It’s also important to remember the inverse bond price and interest rate relationship, which we can transfer to our bond spread trading . Consider a yield spread increase. Take our Sears 11/99 moving or “widening” from an 80 bps spread to a 100 bps spread . This increases its relative interest rate. We start with the Canada 9.25/99 at 4.5% with the Sears at 5.3%, which is 80 bps higher. Let’s say that interest rates don’t change and the Canada stays at 4.5% but because corporate bond supply is heavy the Sears “widen” or increase in spread to 100 bps. This makes a new interest rate of 5.5% on the Sears bond (4.5% + 1% = 5.5%). This means that the price of the Sears bond will fall about $.40 since its interest rate rose. This also means that despite the Canada bond staying at the same price and yield, the Sears bond has fallen $.40 or “under-performed”.
The opposite would be true for a spread tightening. If the yield spread on the Sears bond fell or “tightened” to 60 bps, it means its interest rate had fallen by 20 bps relative to the Canada bond. This would make its price increase relative to the Canada by $.40.
The investor who has bought and held since 1989 has received 10% extra compared to Canada’s (125 bps spread for eight years) and a capital appreciation due to the spread narrowing of about 1% for a total excess return of 11.25%. The investor who bought at the issue spread of 125 bps in 1989 and sold at 425 bps in 1992 received additional spread of 3.75% (3 years of 125 bps ) versus Canada’s, but had a price loss of about 21% due to the spread widening for a total under-performance of Canada’s of –17.25%! The savvy investor who bought in 1992 and has held to 1997 has an excess spread of 21.25% (5 years at 425 bps) and an appreciation from spread narrowing of 6.9% for a total outperformance of 28.2% versus Canada’s over five years. It’s interesting how different a performance can result from the timing when a corporate was bought and sold. This all occurred when Sears Canada was rated investment grade, never falling below a BBB rating.
Who ever said that bonds were boring?


